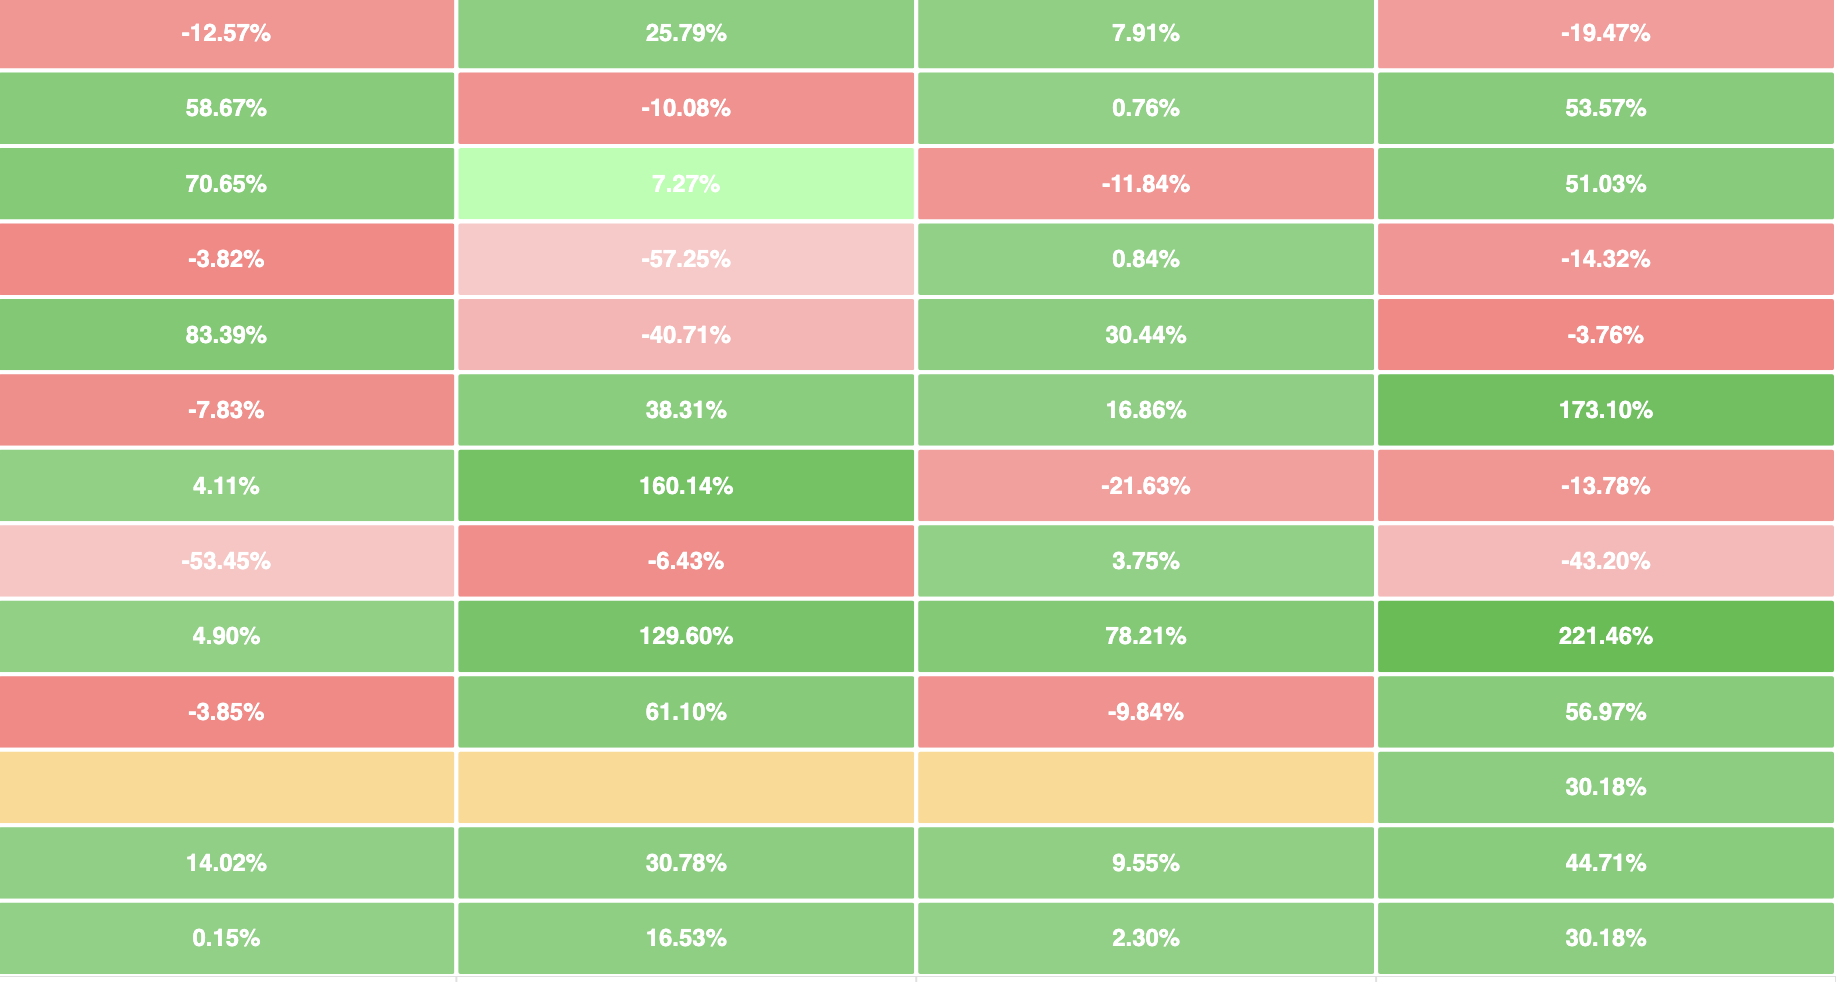
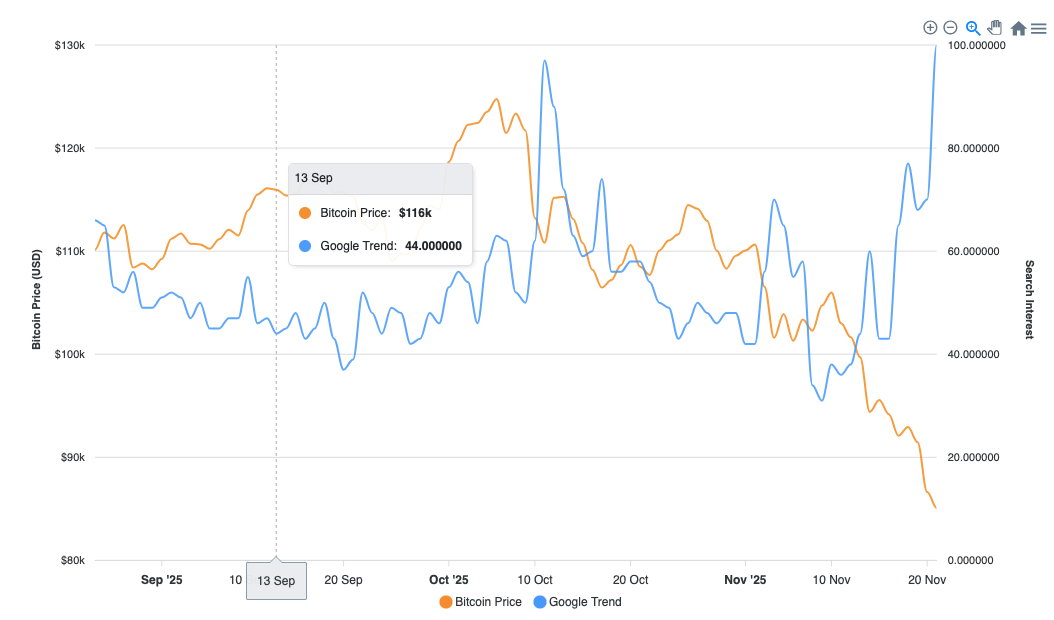
Core Price & Market Structure
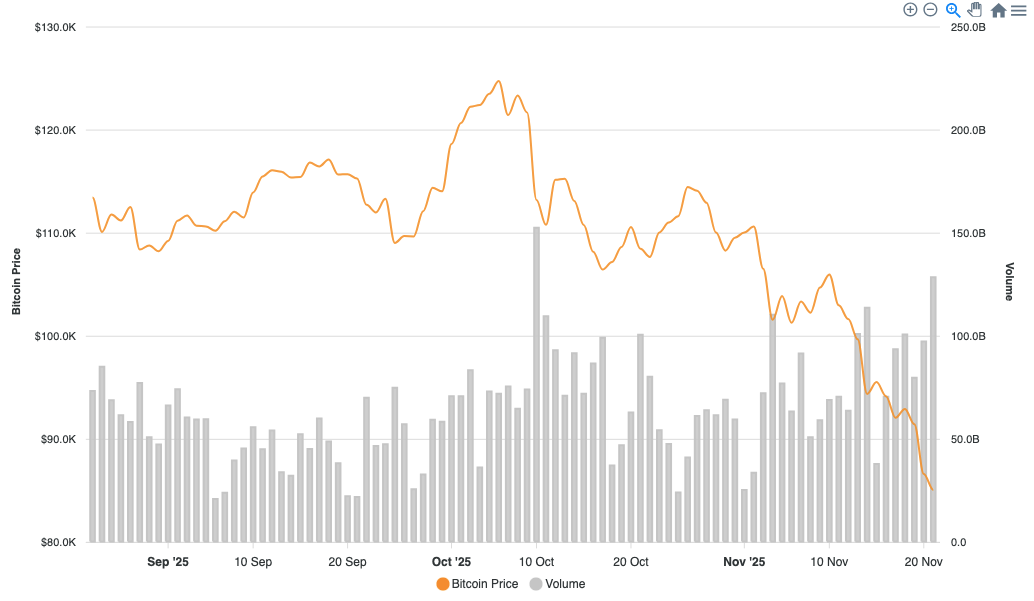
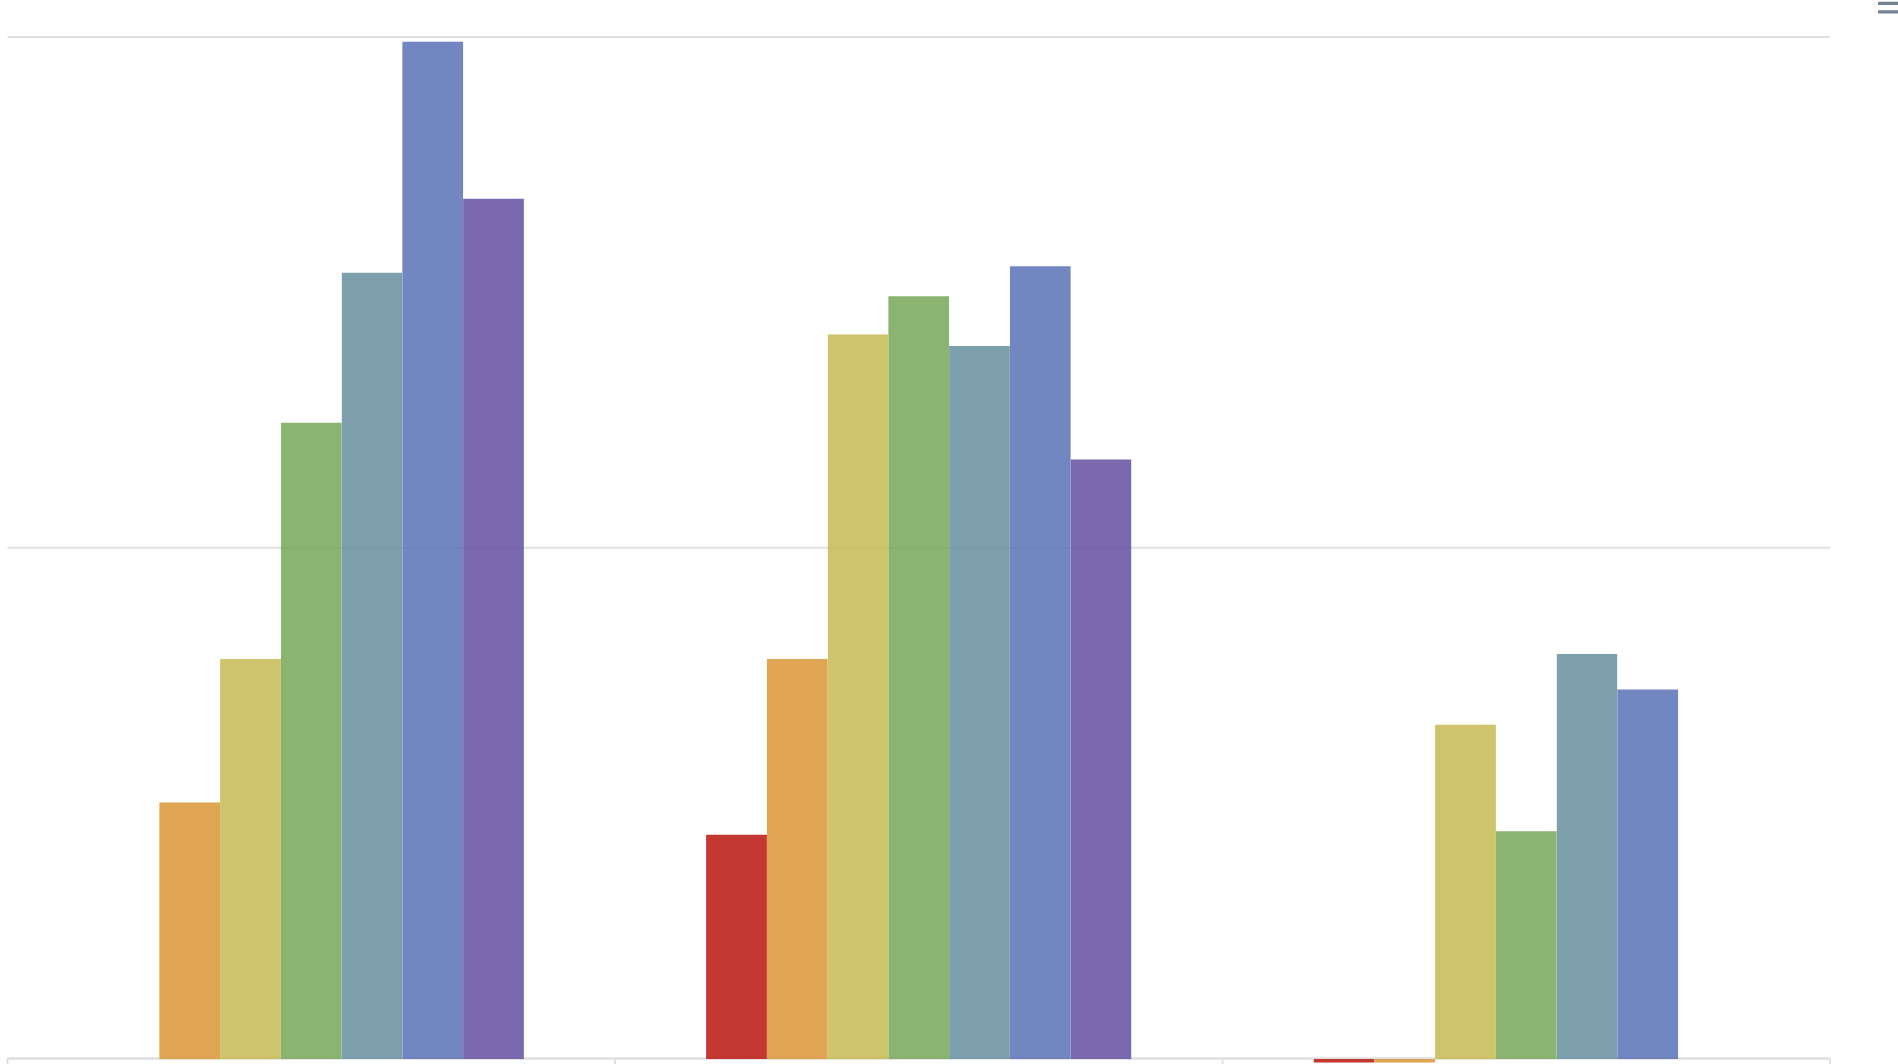
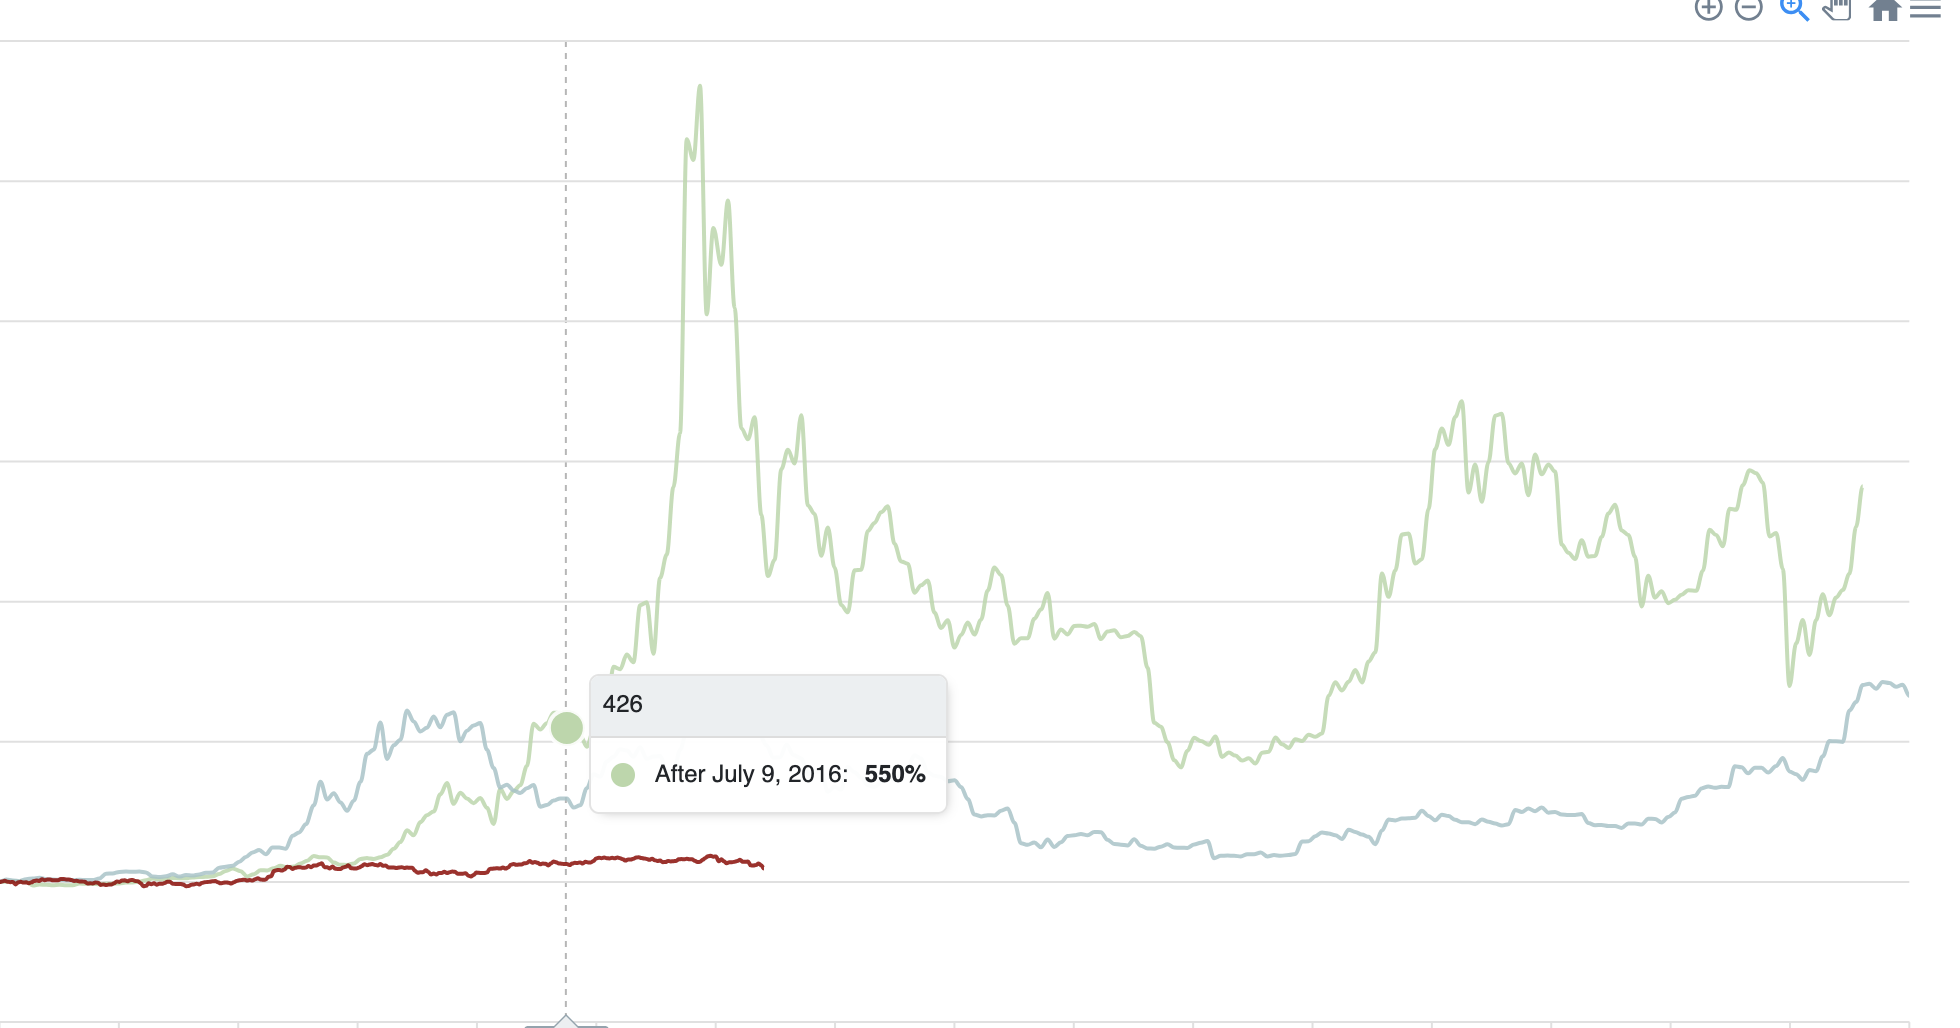
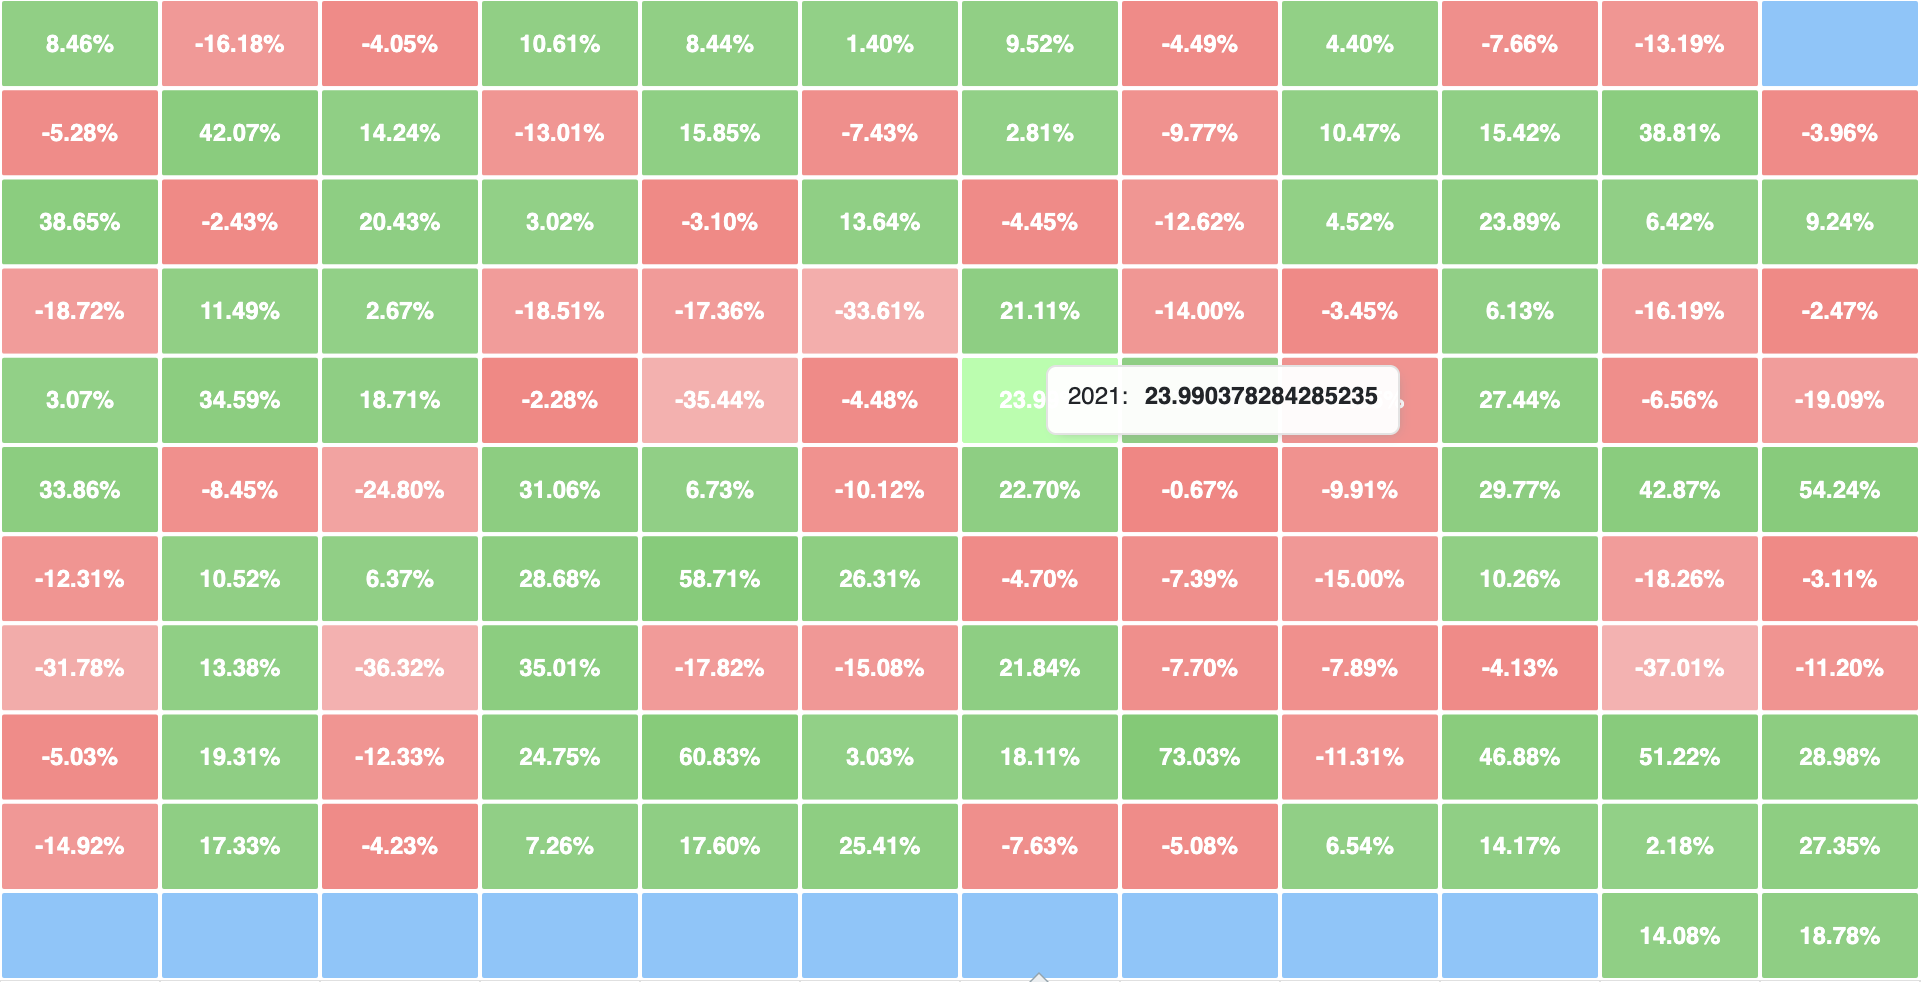
Foundational charts focused on Bitcoin’s price action, volume, and how markets respond around halvings and over time.
Macro Liquidity & USD System
How the global dollar system, Treasury operations, and broad money supply interact with Bitcoin.
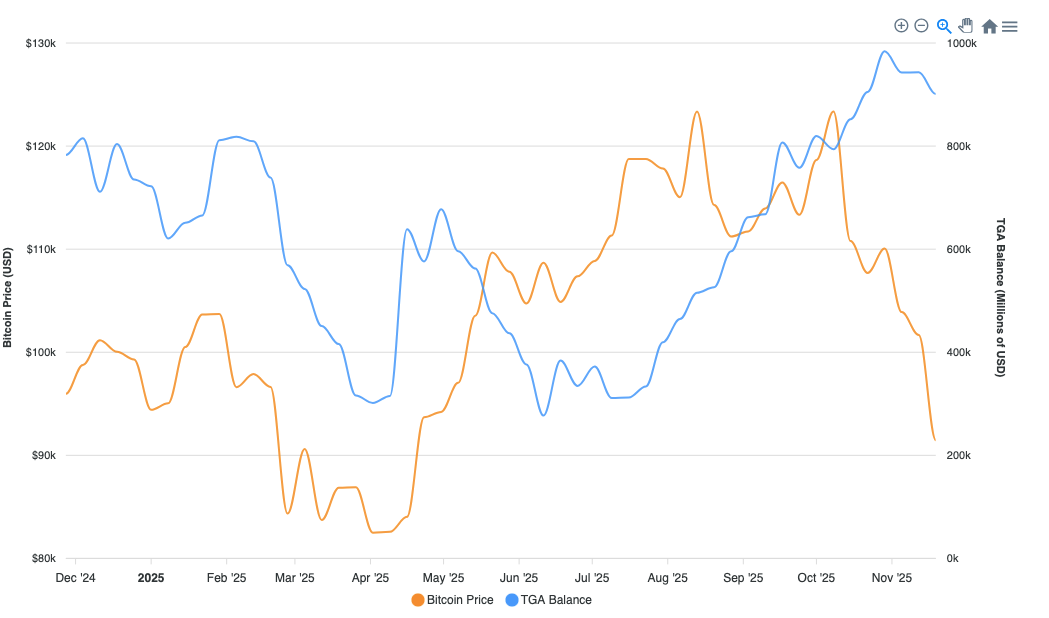
Bitcoin price alongside the Treasury General Account balance to track fiscal-driven USD liquidity cycles.

Composite view of key USD liquidity components versus Bitcoin price.

Bitcoin priced against U.S. M2 money supply (weekly WM2NS) as a proxy for broad dollar liquidity.
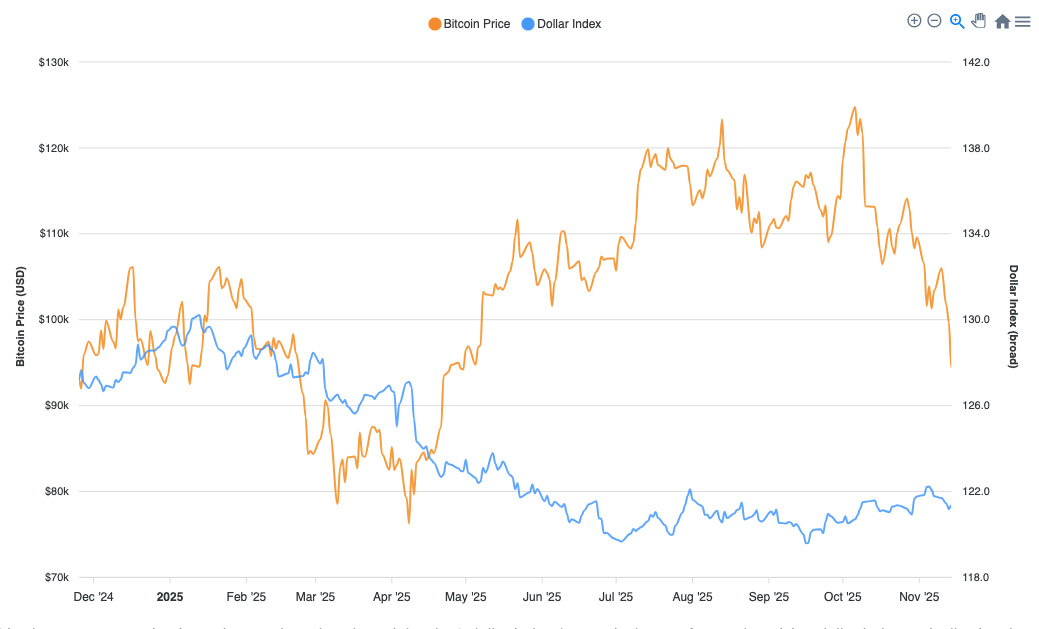
Relationship between Bitcoin and the strength of the U.S. dollar using a DXY proxy.
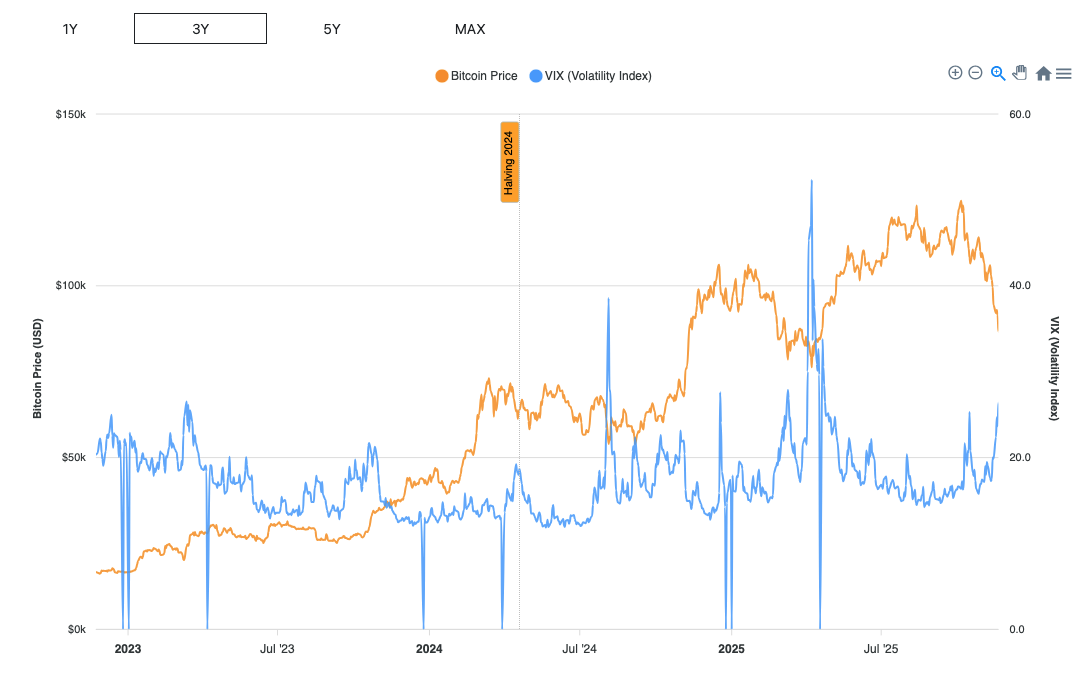
Bitcoin price plotted against the equity market’s volatility index (VIX) to visualize risk-on / risk-off regimes.
Crypto-Native Liquidity & Derivatives
Stablecoins, derivatives positioning, and leverage – the internal plumbing of Bitcoin’s trading ecosystem.

Compare Bitcoin price to aggregate major stablecoin supply as a measure of on-chain dry powder.
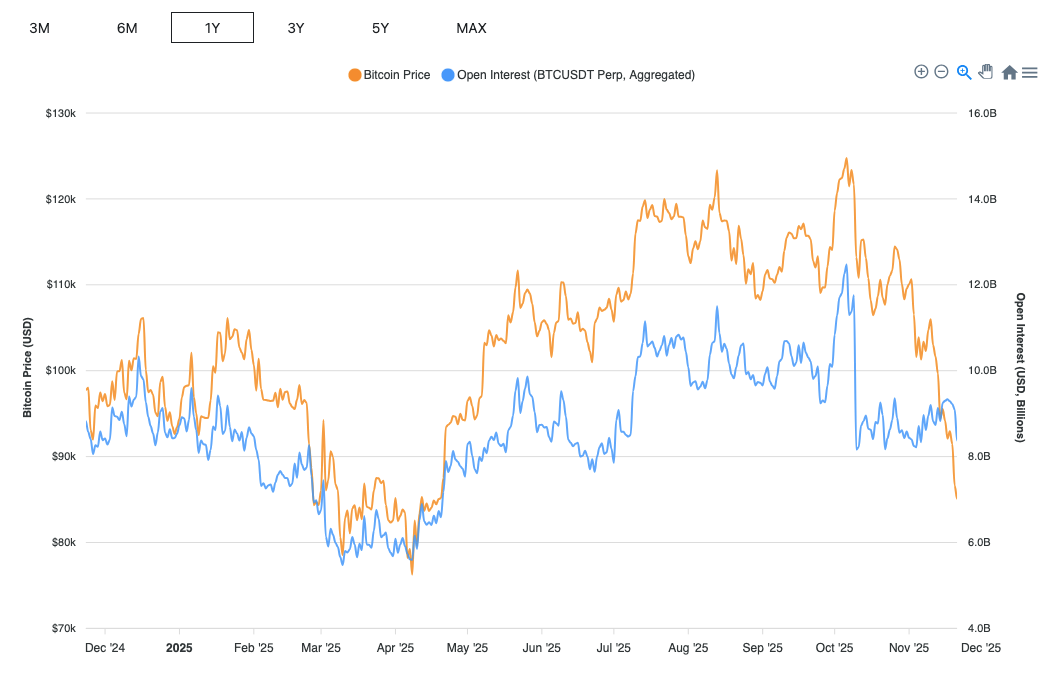
Track Bitcoin futures open interest alongside price to understand leverage buildup and flushes.
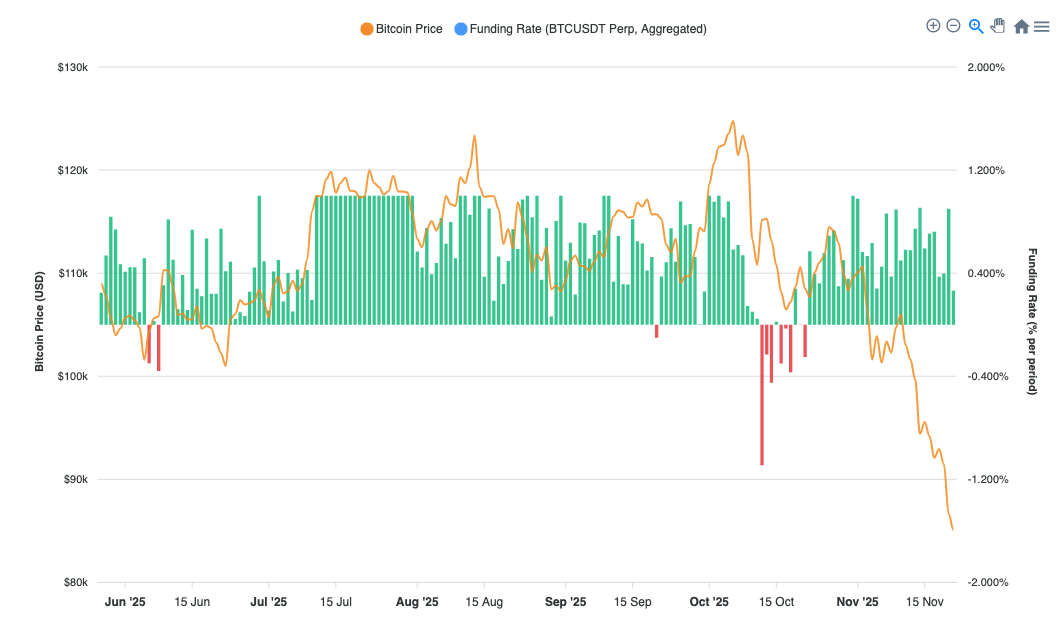
Perpetual futures funding rates vs price – highlighting periods of long/short crowding and liquidation risk.
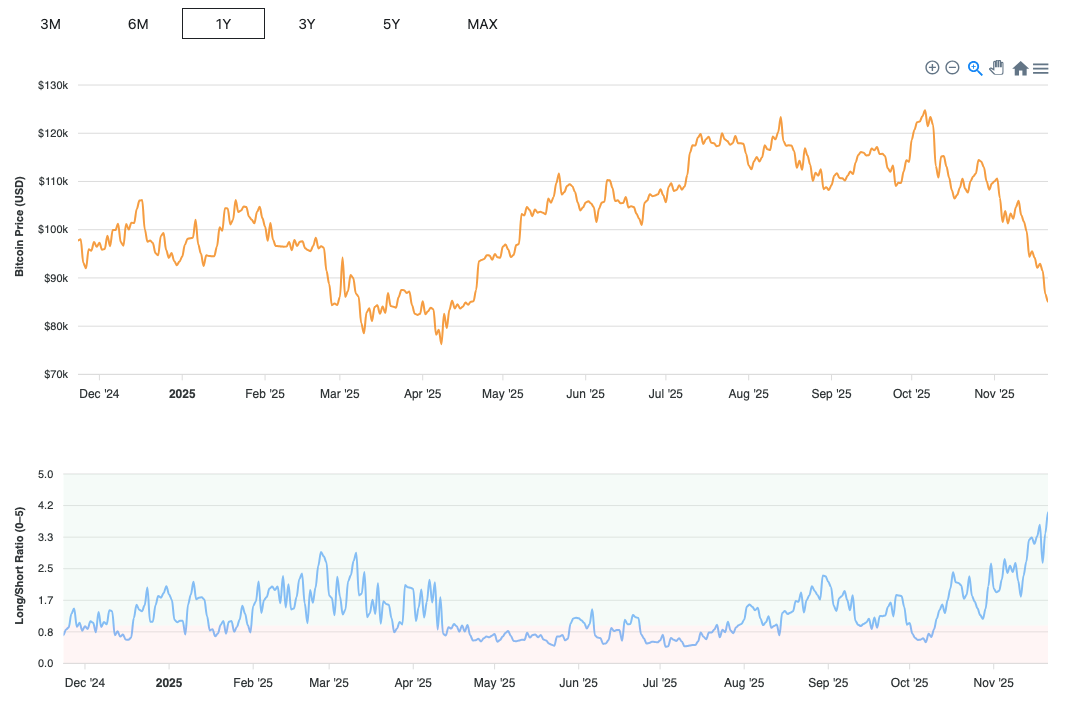
Aggregated long/short accounts ratio compared with BTC price to visualize positioning bias over time.
Valuation & On-Chain Proxies
Higher-level valuation frameworks derived from on-chain data and realized value metrics.
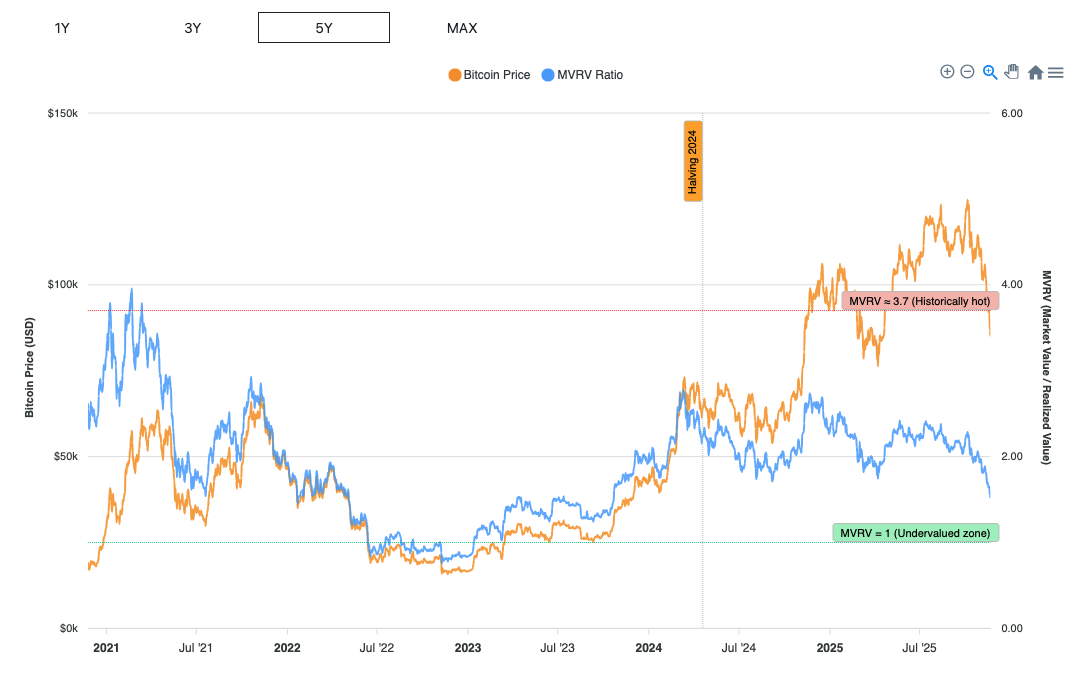
Market Value to Realized Value (MVRV) ratio vs price – a classic on-chain valuation signal for cycle tops and bottoms.
