9 hours ago
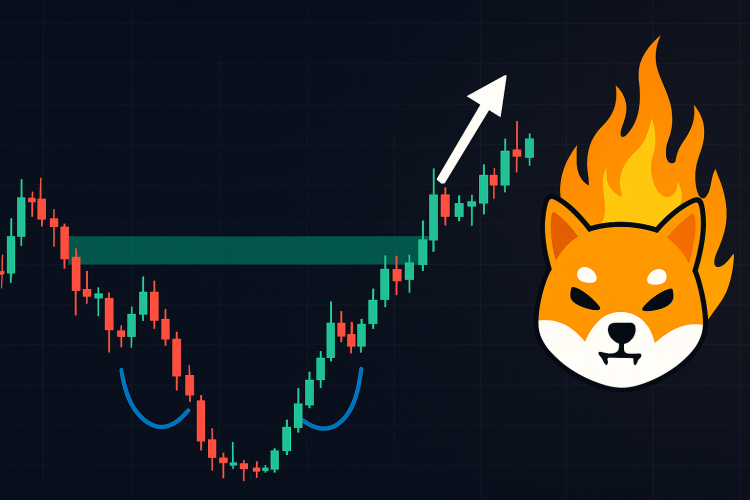
Shiba Inu (SHIB) printed a textbook-grade inverted head-and-shoulders on the daily chart this spring, and Tuesday’s session shows the pattern has now gone through the full breakout-and-retest sequence flagged by independent analyst Cantonese Cat (@cantonmeow). Shiba Inu Completes iH&S Pattern The structure took shape over three distinct troughs: a left shoulder that bottomed just above $0.00001082 in mid-March, a head that wicked to about $0.00001030 in early-April, and a right shoulder that found support near $0.00001230 in the opening days of May. That sequence carved out an arc lasting more than two months, culminating in a decisive surge from May 8 that vaulted price through the neckline with a long, full-bodied green candle. Momentum on that breakout carried SHIB as high as the $0.00001765 region—its loftiest print since early- February—before profit-taking invited a classic “throwback.” Over the past sessions the token has slid back into the neckline zone, where bid interest has so far absorbed supply, validating the level as a fresh support zone between $0.00001400 and $0.00001470. The successful retest is the final criterion many technicians require before calling the pattern complete. Related Reading: Shiba Inu Marks Major Milestone Amid Market Rebound Toward $0.00002 Measured from the head’s extreme to the midpoint of the neckline, the vertical depth of the formation is roughly $0.0000037. Applying that distance to the breakout area confirms the local top at $0.00001765. Cantonese Cat summarised the setup succinctly: “SHIB daily – inverted H&S brokeback pattern completed. Favors bullish continuation.” With the neckline now acting as a springboard, price action over the next few sessions will determine whether bulls can translate the technical victory into fresh upside follow-through or whether bears manage to drag the token back into the former trading range. Related Reading: Shiba Inu Could Erupt 500%—Analyst Sounds The Alarm SHIB Price Targets Upside targets can be found with the help of Fibonacci retracement levels. Anchoring the grid to last summer’s $0.00004569 high and the March swing low at $0.00001030 produces a 23.6 percent retracement at $0.00001865 which forms the second technical waypoint, only after the 200-day EMA at $0.00001603. Should buyers reclaim both lines on a closing basis, the roadmap points toward $0.00002382 (38.2 percent) and the midpoint level at $0.00002799, an area that also coincides with the lower margin of last December’s congestion zone. Beyond it, the golden-ratio mark at $0.00003217 and the 78.6 percent retracement at $0.00003811 frame the penultimate obstacles before any renewed challenge of the macro peak. Conversely, failure to defend the neckline shelf near $0.00001430 would invalidate the bullish script and shift short-term risk back to the 50-day EMA around $0.00001399 and ultimately to the cycle floor at $0.00001030. Until that downside failsafe is breached, the Fibonacci grid argues that momentum remains skewed in favor of buyers pressing for a return into the high-teens and, potentially, the low- twenties in the weeks to follow. Featured image created with DALL.E, chart from TradingView.com